In today's post, I'm gonna write a simple strategy that I've just learnt. And then, I will put some examples into it.
First of all, I don't like too many indicators. I like the rules to be as simple as possible.
In this strategy, you need to set up 5 charts on the same currencies but different time frames. For example, create a profile named 'EURUSD' and then set up 5 EUR/USD charts with Time Frame M1, ,M5, M15, M30 and H1.
Indicators that I'll be using are:
1. EMA 30
2. Stochastic
3. Fibonacci Expansion (to get the rough target)
Set the 1st 2 indicators on your chart and save the template so that you can just load the template on all the rest of the charts.
Alright, here is the trading plan:
- M15, M30 and H1 are the trends. Look at any one of them.
- Make sure that the price bar is above EMA 30.
- Make sure the stochastic has just crossed from overbought/oversold level.
- If M15 match the criteria, look at M1 for entry when it matches the same criteria. If M30 matches, look at M5 for entry. If H1 matches, look at M15 for entry.
- Alright, after you have opened a position, set up the fibonacci expansion on your entry chart to set TP. I don't like to close manually. I rather set TP so that I can forget about it.
EXAMPLES:
EUR/USD:
Alright. Here you are seeing the 15 min chart. Stochastic had just crossed from oversold area at 18:00. In the meantime, price is above EMA 30. Which means I will be looking at1 minute chart for a buy opportunity.
At 18:00 1 minute chart, you can see that stochastic is at overbought area. So it is not a good idea to buy now. I will be waiting for stochastic to crossed over from oversold area to buy.
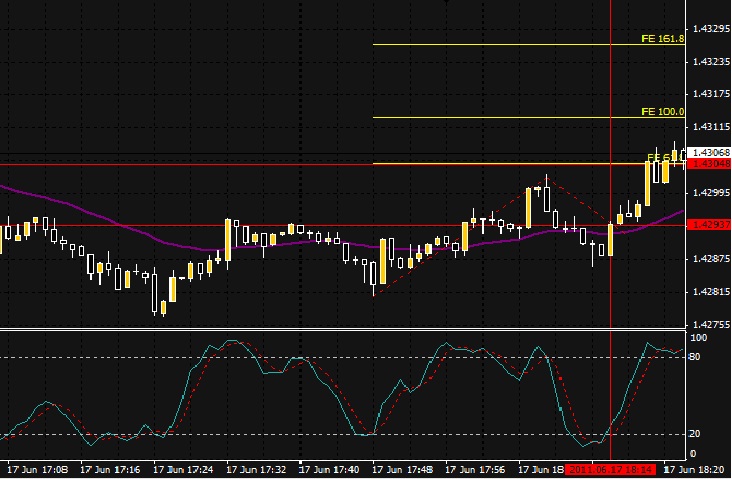
Alright! At 18:14 1 minute chart, stochastic is crossing over from oversold. Price is above EMA30. I will be waiting for this price bar to close above EMA 30 and buy on the next bullish candle. In the meantime, I have set the fibonacci expansion. My TP target will be at 61.8. Let see what happens next.
As you can see, the price hit my target. About 10 pips from this trade within 4 minutes. Not bad eh? Let's look at another example.
USD/JPY:
We are looking at USD/JPY 30 minute chart right now. Stochastic just crossed over from overbought to oversold. Price is below EMA 30 at 4:30. So I am going to look for a sell opportunity at M5 chart.
At 4:45, stochastic has just crossed over from overbought area. Price is below EMA 30. It seems good to open now. Fibonacci expansion has been set up. TP target at 61.8. Let's see whether the price will hit my target.
Alright! It did hit. About 6 pips from this trade. Let's look at another example.
GBP/USD:
Right now, we are looking at H1 chart at 8:00. Price is below EMA 30 which means its trending down. But stochastic is heading up which means that the price is retracing now. So if I were to buy, I need to take one swing only and not more than that. I can't expect much from this trade set up. So let's look for a buy opportunity at M15 chart now.
At 8:30 M15 chart, you can see that stochastic just crossed over from oversold area. Price is at EMA 30. I'll be buying when this candle closes and the next candle is above EMA 30. I have set up the Fibonacci. But this time, I did not target 61.8. Instead, I target 100.00 because if I were to target 61.8, the move would be super small for M15. So 100.00 area is an acceptable target for me in this case. Let's look what happened next.
Alright!! The price hit my target. About 20 pips from this trade.
In total, the 3 examples that I've just shown add up to about 37 pips. Well, it does not sounds bad to me.
In conclusion, for me, I don't need to sit in front of your computer all the time. Once I find a good set up, I will just open it and set TP&SL. Then I can forget about it and do something else. Well, it depends on your nature. For me, I rather not get mixed up with my own emotions.
I'll be writing my intraday analysis in the next post. Oh by the way, this is just for education purposes for me so that I can refer to it whenever I want. Its not the actual trade that I made.