Indicators: EMA 30, CCPI, IBFX Weekly Pivot, Fibonacci Expension / Retarecement
Time Frame: 4 hour
Trading Plan:
1. Look at CCPI. Only open trades on pairs that has at least -50/+50. Do not trade in between that.
2. Look at EMA 30. If price is above EMA 30 and the signal is sell, plot Fibo Retracement to set TP. Otherwise, use Fibo Extension to set TP.
3. Look at Weekly Pivot. Price has to exceed / break the reversal point. If price is at the pivot line / support / resistance, do not enter. You may open a pending order a few pips above / below the reversal point. Otherwise, just check it out again after 4 hours.
4. To set TP, you need to make sure the fibo point is as close as possible to the Reversal points (Pivot). Do not exceed it. For example, if R1 is between 100% and 161%, set TP at 100%.
5. Use a 5% money management.
6. Sometimes, CCPI will falls on the same line as EMA 30, Pivot. Just be patient and wait for it to break / reverse.
Thursday, July 28, 2011
Sunday, July 17, 2011
Swing: Zigzag - EMA 30 - Stoc - Fib
Indicators needed:
1. Zigzag
2. EMA 30
3. Stochastic
4. Fibonacci Retracement or Extension
Time Frame: H4 / D1
Trading Plan:
1. Look at zigzag. Make sure it has finished performing its upward/downward move.
2. Look at stochastic. Make sure it is crossing over from either overbought/oversold level.
4. Draw a fibonacci retracement if price is above EMA 30 when you sold. TP at 50%.
5. Draw a fibonacci retracement if price is below EMA30 when you bought. TP at 50%.
6. Draw a fibonacci expension if price is below EMA30 when you sell. TP at 100%.
7. Draw a fibonacci expsension if price is above EMA 30 when you buy. TP at 100%.
Example:
1. EUR/USD

2. USD/JPY

3. GBP/USD

4. USD/CHF

5. AUD/USD

6. EUR/CHF

7. EUR/JPY

1. Zigzag
2. EMA 30
3. Stochastic
4. Fibonacci Retracement or Extension
Time Frame: H4 / D1
Trading Plan:
1. Look at zigzag. Make sure it has finished performing its upward/downward move.
2. Look at stochastic. Make sure it is crossing over from either overbought/oversold level.
4. Draw a fibonacci retracement if price is above EMA 30 when you sold. TP at 50%.
5. Draw a fibonacci retracement if price is below EMA30 when you bought. TP at 50%.
6. Draw a fibonacci expension if price is below EMA30 when you sell. TP at 100%.
7. Draw a fibonacci expsension if price is above EMA 30 when you buy. TP at 100%.
Example:
1. EUR/USD

200 pips
2. USD/JPY

70 pips
3. GBP/USD

60 pips
4. USD/CHF

70 pips
5. AUD/USD

100 pips
6. EUR/CHF

170 pips
7. EUR/JPY

75 pips

8. EUR/GBP

-77 pips
Monday, July 4, 2011
Parabolic - Stoch -RSI
1. Look at 2 time frames. (M5/M30, M15/H1, /H1/H4, H4/D1)
-trend at either m30/h1/h4/d1
-entry at either m5/m30/h1/h4
2. Look at trend.
-parabolic must be buy/sell
-Stochastic must be just from overbough to oversold or vice versa
-RSI must below/above 50
3. Look at entry TF accordingly.
- Conditions must match the trend conditions above except that stochastic not
necessarily from overbought/oversold.
4. PLot Fibo expension to determine TP.
5. Set SL below the entry bar
Bollinger - RSI - MACD
Indicators needed:
- Bollinger band - to set TP
- RSI
- MACD
Trading Rules:
- Make sure price has hit the either ends of the bollinger bands / the middle line of the bollinger band.
- RSI must be below/above 50.
- MACD must be above/below the 0.0 line
- Once all these conditions happens, enter the trade and set TP at the either end of the bollinger band.
- Set SL on the latest support or resistance.
Monday, June 20, 2011
Simple Balanced System - Modified
Indicators:
1. Parabolic SAR
2. EMA 5, 10
3. Stochastic (14, 3, 3)
4. RSI (14, 30, 70, 50)
Trade Plane:
1. Look for a new Parabolic SAR formation. When the 1st dot appears, look for the crossing of EMA 5 & 10.
2. If both 1st dot of SAR and EMAs crossing happens at the same time, look at Stochastic and RSI.
3. Stochastic must be either moving up or down. Just make sure it is not in the over bought or over sold area.
4. RSI must be below or above 50.
5. If all those conditions above happens at the same time when the 1st dot appears, enter the trade.
6. Set Fibonacci Expansion as profit target.
7. Set SL at the resistance/support level.
I will include the examples later on.
Friday, June 17, 2011
Scalping
In today's post, I'm gonna write a simple strategy that I've just learnt. And then, I will put some examples into it.
First of all, I don't like too many indicators. I like the rules to be as simple as possible.
In this strategy, you need to set up 5 charts on the same currencies but different time frames. For example, create a profile named 'EURUSD' and then set up 5 EUR/USD charts with Time Frame M1, ,M5, M15, M30 and H1.
Indicators that I'll be using are:
1. EMA 30
2. Stochastic
3. Fibonacci Expansion (to get the rough target)
Set the 1st 2 indicators on your chart and save the template so that you can just load the template on all the rest of the charts.
Alright, here is the trading plan:
EXAMPLES:
EUR/USD:

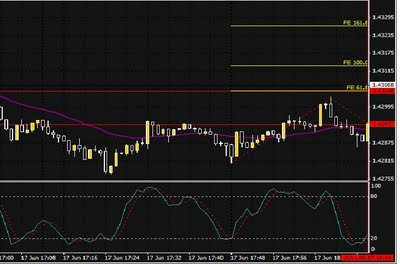
Alright. Here you are seeing the 15 min chart. Stochastic had just crossed from oversold area at 18:00. In the meantime, price is above EMA 30. Which means I will be looking at1 minute chart for a buy opportunity.

At 18:00 1 minute chart, you can see that stochastic is at overbought area. So it is not a good idea to buy now. I will be waiting for stochastic to crossed over from oversold area to buy.
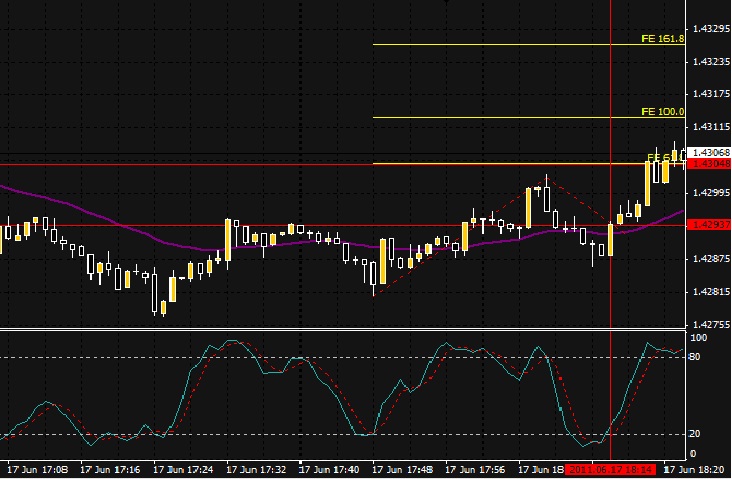
Alright! At 18:14 1 minute chart, stochastic is crossing over from oversold. Price is above EMA30. I will be waiting for this price bar to close above EMA 30 and buy on the next bullish candle. In the meantime, I have set the fibonacci expansion. My TP target will be at 61.8. Let see what happens next.

As you can see, the price hit my target. About 10 pips from this trade within 4 minutes. Not bad eh? Let's look at another example.
USD/JPY:

We are looking at USD/JPY 30 minute chart right now. Stochastic just crossed over from overbought to oversold. Price is below EMA 30 at 4:30. So I am going to look for a sell opportunity at M5 chart.

At 4:45, stochastic has just crossed over from overbought area. Price is below EMA 30. It seems good to open now. Fibonacci expansion has been set up. TP target at 61.8. Let's see whether the price will hit my target.
 Alright! It did hit. About 6 pips from this trade. Let's look at another example.
GBP/USD:

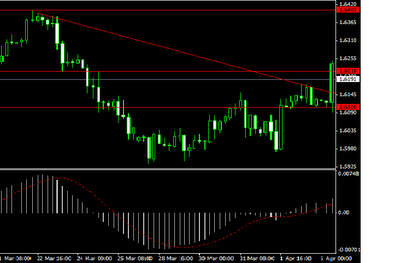
Right now, we are looking at H1 chart at 8:00. Price is below EMA 30 which means its trending down. But stochastic is heading up which means that the price is retracing now. So if I were to buy, I need to take one swing only and not more than that. I can't expect much from this trade set up. So let's look for a buy opportunity at M15 chart now.
 At 8:30 M15 chart, you can see that stochastic just crossed over from oversold area. Price is at EMA 30. I'll be buying when this candle closes and the next candle is above EMA 30. I have set up the Fibonacci. But this time, I did not target 61.8. Instead, I target 100.00 because if I were to target 61.8, the move would be super small for M15. So 100.00 area is an acceptable target for me in this case. Let's look what happened next.

Alright!! The price hit my target. About 20 pips from this trade.
In total, the 3 examples that I've just shown add up to about 37 pips. Well, it does not sounds bad to me.
In conclusion, for me, I don't need to sit in front of your computer all the time. Once I find a good set up, I will just open it and set TP&SL. Then I can forget about it and do something else. Well, it depends on your nature. For me, I rather not get mixed up with my own emotions.
I'll be writing my intraday analysis in the next post. Oh by the way, this is just for education purposes for me so that I can refer to it whenever I want. Its not the actual trade that I made.
First of all, I don't like too many indicators. I like the rules to be as simple as possible.
In this strategy, you need to set up 5 charts on the same currencies but different time frames. For example, create a profile named 'EURUSD' and then set up 5 EUR/USD charts with Time Frame M1, ,M5, M15, M30 and H1.
Indicators that I'll be using are:
1. EMA 30
2. Stochastic
3. Fibonacci Expansion (to get the rough target)
Set the 1st 2 indicators on your chart and save the template so that you can just load the template on all the rest of the charts.
Alright, here is the trading plan:
- M15, M30 and H1 are the trends. Look at any one of them.
- Make sure that the price bar is above EMA 30.
- Make sure the stochastic has just crossed from overbought/oversold level.
- If M15 match the criteria, look at M1 for entry when it matches the same criteria. If M30 matches, look at M5 for entry. If H1 matches, look at M15 for entry.
- Alright, after you have opened a position, set up the fibonacci expansion on your entry chart to set TP. I don't like to close manually. I rather set TP so that I can forget about it.
EXAMPLES:
EUR/USD:

Alright. Here you are seeing the 15 min chart. Stochastic had just crossed from oversold area at 18:00. In the meantime, price is above EMA 30. Which means I will be looking at1 minute chart for a buy opportunity.

At 18:00 1 minute chart, you can see that stochastic is at overbought area. So it is not a good idea to buy now. I will be waiting for stochastic to crossed over from oversold area to buy.

Alright! At 18:14 1 minute chart, stochastic is crossing over from oversold. Price is above EMA30. I will be waiting for this price bar to close above EMA 30 and buy on the next bullish candle. In the meantime, I have set the fibonacci expansion. My TP target will be at 61.8. Let see what happens next.
As you can see, the price hit my target. About 10 pips from this trade within 4 minutes. Not bad eh? Let's look at another example.
USD/JPY:

We are looking at USD/JPY 30 minute chart right now. Stochastic just crossed over from overbought to oversold. Price is below EMA 30 at 4:30. So I am going to look for a sell opportunity at M5 chart.

At 4:45, stochastic has just crossed over from overbought area. Price is below EMA 30. It seems good to open now. Fibonacci expansion has been set up. TP target at 61.8. Let's see whether the price will hit my target.

GBP/USD:

Right now, we are looking at H1 chart at 8:00. Price is below EMA 30 which means its trending down. But stochastic is heading up which means that the price is retracing now. So if I were to buy, I need to take one swing only and not more than that. I can't expect much from this trade set up. So let's look for a buy opportunity at M15 chart now.


Alright!! The price hit my target. About 20 pips from this trade.
In total, the 3 examples that I've just shown add up to about 37 pips. Well, it does not sounds bad to me.
In conclusion, for me, I don't need to sit in front of your computer all the time. Once I find a good set up, I will just open it and set TP&SL. Then I can forget about it and do something else. Well, it depends on your nature. For me, I rather not get mixed up with my own emotions.
I'll be writing my intraday analysis in the next post. Oh by the way, this is just for education purposes for me so that I can refer to it whenever I want. Its not the actual trade that I made.
Sunday, May 15, 2011
Swing Trading
2 days ago, I came across this post http://www.forexindicator.org/forex-swing-trading-strategy-explained.html
After analysing the currencies history, I modified the strategy slightly as below.
Indicators:


After analysing the currencies history, I modified the strategy slightly as below.
Indicators:
- trend line
- MACD
Time Frame: 4hr/daily (because I am working)
To me, I am comfortable enough with those 2 elements. I don't like to see a messy chart.
Trading plan:
- Draw a trend line
- Enter when the price broke the trend line and MACD crossed above/below the zero line
- Set SL at the recent resistance/support before the breakout
- Set TP at previous resistance/support
- Set Trailing SL accordingly either the difference between SL & open price or half of it
Ok now I will give some examples based on history
EUR/USD

ok as you can see, price broke the trend line. MACD crossed below the zero line. my SL is 150 pips.
TP is about 300 pips. Trailing SL is 70 pips. Let's look on what happened next.

Price did go down about 200 pips and then goes back up. Is that a good news or bad news? Its good!! I managed to secure at least 140 pips because of trailing SL.
GBP/USD

Price broker the down trend. MACD crossed over the zero line. SL is 100 pips. TP is about 180 pips. Trailing SL is about 50 pips. Let's see what happens next.

Price hit TP which is about 180 pips. But because I set trailing SL at 50 pips, it got hit. But its ok. At least I secured 80 pips.
USD/JPY

SL: 200 pips. TP: 700 pips. Trailing SL: 100 pips. Let's see what happen next.

It got stopped out at about 82.15 because of Trailing SL. How much profit? 125 pips. not bad right? Anyway, it continued it downwards movements after that.
USD/CHF

SL: 130 pips. TP: 320 pips. Trailing SL: 130 pips.
Let's see what happened next.

It is currently on floating of about 250 pips. Is that good or what?!
AUD/USD

SL: 130 pips. Trailing SL: 130 pips. For this trade, I did not set any TP as I don't know where to place the TP. Let's see what happened next.

Snap!! The price move back upwards. Lost 130 pips from this trades. Its ok ~ :)
EUR/CHF

SL: 140 pips. TP: 615 pips. Trailing SL: 140 pips. Let's see what happened next.

The price hit trailing SL. 170 pips from this trade. Not bad to me.
EUR/GBP

SL: 50 pips. TP: 90 pips. Trailing SL: 25 pips. Let's see what happened next.

It hit Trailing SL. About 25 pips from this trade. The price moved upwards back after that. Its good that I secured some profits.
EUR/JPY

SL: 150 pips. TP: 1390 pips. SL: 150 pips. Let's see what happened next.

Trailing SL hit again. About 250 pips profits.
In conclusion, out of 8 trades, 1 trade lose. Total P/L is +900+ pips.
Thursday, March 17, 2011
07/03/2011-17/03/2011
Please refer to Zigzag and PA strategy here.
09/03/2011
1. AUD/USD
 As you can see, the price bounces from the previous resistance downwards. So, I know its not a good entry. But still, the previous support was not reached yet which is at 0.9940. So, I entered a trade at 1.0007. I set SL on the previous resistance which is at 1.0199 and TP at the previous support which is at 0.9940. Let's take a look on what happened below.
 The price went down to my favour. Was it a luck? I don't know. Anyway 130 pips from this trade.
2. EUR/USD

Alright. I drew a trend line and it was a clear uptrend. Let see. The price retraces to the previous support which is at about 1.3853 and it bounces. There was also a trend reversal Bullish bar on the 5th last bar. I happened to be at 1.3890. So I opened a buy trade at that point. TP: 1.4014(previous resistance). SL: initially it was 1.3742. After a few days, I adjusted the SL to 1.3754.
Let's see the result below.
 The price went down and hit the support trendline. Then it went up and hit the TP. 124 pips from this trade.
3. EUR/CHF
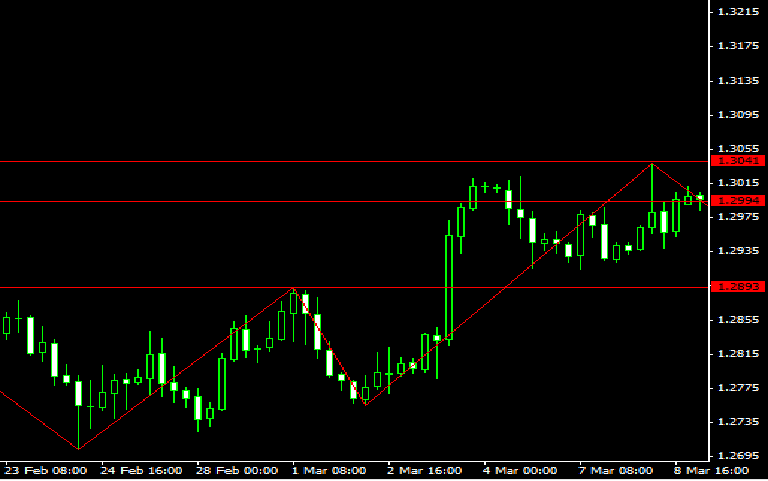
 For this chart, its kinda conservative. It can be a buy/sell signal. But I placed a sell trade at 1.2994 because I happened to be there. LOL. Why did I open a sell trade? As you can see the price is making an uptrend. So I happened to remember Elliot Wave Theory(you google it. I am not really sure what is it about). So based on my understanding, this Elliot theory states that I am currently on the 4th wave which is the correction move or in a layman term, they call it retracement.
So, I took it as the price will retrace. But to where? hmm I think to the previous support before it continues it uptrend. So in this trade, I placed a quite tight stop loss because I happened to be in a good trade position. SL: 1.3040, TP: 1.2915(Please don't ask me why as I also can't remember why do I set it at that point instead of 1.2893).
Let's see the result below.
 Yeap. The price went down to my favour. Luckily I did not open a buy trade. 85 pips from this trade.
========================================
15/03/2011
1. USD/CHF
 Trend? Its ranging and its already broken downwards. So before I placed a sell trade, I made sure that the price retraced, hit the previous support and bounces off it at about 0.9328. So I opened a trade at 0.9244. SL: 0.9461 (why? open your MT4 platform and have bigger view on what is there at this point). TP: 0.8928 (I can't remember why did I set it at that point. If I am not wrong it is the difference between the 2 horizontal lines within the ranging trend. Hence, 0.9328-400pips = 0.8928 = TP)
Let's see the result..
 The price hit the target. 353 pips from this trade.
16/03/2011
1. GBP/USD
losing trade. -39 pips. I am exhausted and I don't feel like writing for this. LOL >_<
Statement overview:

09/03/2011
1. AUD/USD


2. EUR/USD

Alright. I drew a trend line and it was a clear uptrend. Let see. The price retraces to the previous support which is at about 1.3853 and it bounces. There was also a trend reversal Bullish bar on the 5th last bar. I happened to be at 1.3890. So I opened a buy trade at that point. TP: 1.4014(previous resistance). SL: initially it was 1.3742. After a few days, I adjusted the SL to 1.3754.
Let's see the result below.

3. EUR/CHF
So, I took it as the price will retrace. But to where? hmm I think to the previous support before it continues it uptrend. So in this trade, I placed a quite tight stop loss because I happened to be in a good trade position. SL: 1.3040, TP: 1.2915(Please don't ask me why as I also can't remember why do I set it at that point instead of 1.2893).
Let's see the result below.

========================================
15/03/2011
1. USD/CHF

Let's see the result..

16/03/2011
1. GBP/USD
losing trade. -39 pips. I am exhausted and I don't feel like writing for this. LOL >_<
Statement overview:

Wednesday, March 9, 2011
Zigzag and Price Action Strategy
First of all, I would like to give a special thanks to my friend Chen Mao Yuan for teaching me the basis that made up this strategy. And also I would like to thank another friend of mine, Jason Lim for his keen support, motivation, and more? LOL
I am currently determined to trade with this strategy. Please note that it is not a fool proof strategy. Its not perfect. Let's get started
Time Frame: 4Hr/Daily
Indicators: zigzag (under custom indicators), trendlines
TP: previous resistance/support/pivot point
SL: recent resistance/support
Frequency: Trade only when you are free and have time to analyze for about 10 minutes. Once you open a trade, that's it for today. You may check it tomorrow or after a few days.
Trading Plan:
1. Have a clear view of the direction of the trend
2. Enter a trade once the price bounces off the resistance/support and slighly closes above it as you can see from zigzag.
3. set TP on the previous resistance/support/pivot point
4. set SL on recent resistance/support
I will post updates on this method in a few weeks time because I only trade once a week using this strategy which is ideal for those who are busy.
I SIMPLY LOVE THIS TRADING PLAN SO MUCH!!
Please follow this link to see examples.
10 Pips Strategy
A few days ago, I stumbled upon a strategy that I read at http://forex-strategies-revealed.com/simple/10pipsaday .
So what is it about? Let me briefly explain to you:
1. Time Frame: Daily
2. Indicators: no need
3. Currency: This strategy can be applied on all curencies.
Trading plan:
Immediately after the opening of new candle, you need to place 2 limit orders(buy and sell) 30 pips away from the open price. TP is 10 pips. SL is 50 pips.
I am currently testing this trading strategy as it seems simple and many traders claimed that it produces 90% accuracy. Let see how it goes on.
Disadvantage: Because I live in Singapore, I need to be ready to place orders at about 7 am. That is the timing for a new daily candle to form. Hikhik >_<
Advantage: Simple. Set and forget. Check the result the following day.
Please note that you need to close all orders that have not been executed the following day.
Monday, February 7, 2011
Trade Setup 08/02/2011
Today, a friend of mine taught me on how to trade like what he did. This trading method is based on price action on daily chart that I refer to at forextrading.com
Oh by the way, I did not focus on SL nor did I set it properly.
Executed Trade:
EUR/CHF: SELL
CAD/JPY: SELL
EUR/JPY: BUY
CHF/JPY: BUY
I still have about 5 more limit orders. But I am not gonna post it here because I am too lazy to post. LOL
happy trading! :)
Oh by the way, I did not focus on SL nor did I set it properly.
Executed Trade:
EUR/CHF: SELL
- Open price: 1.2993
- TP: 1.2800
- SL: 1.3088
CAD/JPY: SELL
- Open price: 83.09
- TP: 81.50
- SL: 83.91
EUR/JPY: BUY
- Open price: 112.05
- TP: 113.00
- SL: 111.23
CHF/JPY: BUY
- Open price: 86.24
- TP: 87.50
- SL: 85.42
I still have about 5 more limit orders. But I am not gonna post it here because I am too lazy to post. LOL
happy trading! :)
Subscribe to:
Comments (Atom)
